

Introduction
A robust financial plan provides the framework for forecasting revenue, managing costs, and ensuring the financial viability of your proposed project. Using an illustrative example from the alcoholic beverages market, where we need to identify the financial viability of introducing a new variant of Mead in the market, this guide will help you understand the key components of a financial plan.
For a project to be financially viable, it needs to Break-even in few initial years and should have a positive Net Present Value. Following are the steps to estimate Break-even point and NPV of project.
Step 1: Market Analysis and Demand Forecasting
Begin by analyzing the market to estimate potential demand, which can be estimated through following steps:
- Market Size: Find the Market Size of your Segment from different market reports
- Market Share: Study the market share of key competitors and their growth trajectories.
- Competitor Benchmarking: Use competitors’ performance/ value proposition as a benchmark to estimate how many customer will prefer your products/ services which will give potential demand for your product. Following is example of competitor benchmarking of Ed-tech startup conducted based on few important metrics/ features to arrive at client’s potential market share.
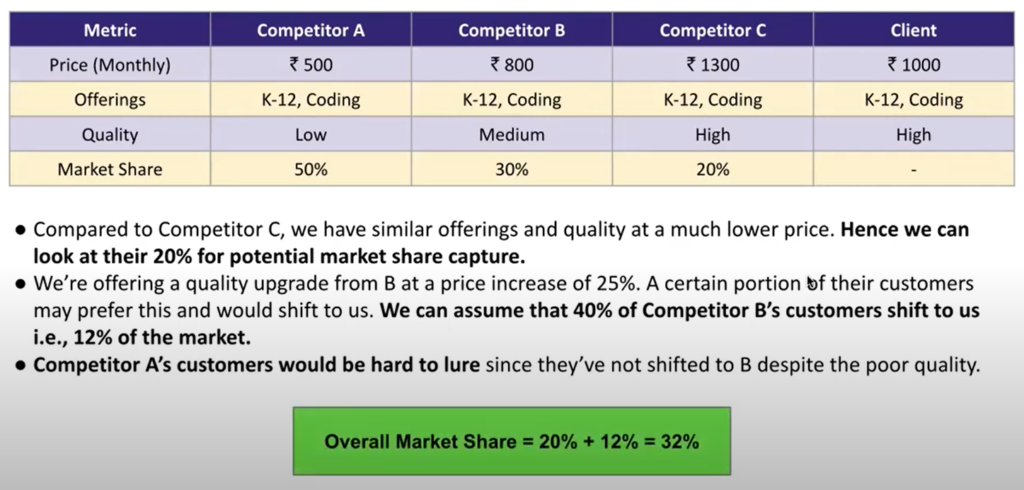
Image: Competitor Benchmarking of a Ed-tech Company
Example: Estimating Potential Demand for new variant of Mead in India
- Market Segment: Mead
- Initial Market Size of Mead in India: 1.8 million bottles (Based on market reports)
- Assumed Market Capture in Year 1: 50% (Estimate based on competitors, your value proposition & other strengths)
- Estimated Year 1 Demand: ~900,000 bottles
- Growth Rate: Compound Annual Growth Rate (CAGR) for mead at ~15% (Based on market reports)
- Forecasted Year 4 Demand: ~1.6 million bottles
Step 2: Cost Estimation and Infrastructure Investment
Identify and estimate the costs associated with producing and delivering your product or service. This includes both initial setup costs and ongoing operational expenses.
Example: Cost Estimate for Mead Project
| Infrastructure installation and capability cost (in 000’s) | Y1 | Y2 | Y3 | Y4 |
| Overall installation cost for equipment | 131000 | |||
| Cost of repair (5% of equipment cost) | 6550 | |||
| Variable cost (Raw material, Packaging, storage) | a | |||
| Human resource cost | b | |||
| Logistics (32ft MXL truck/20000 bottles per truck) | c | |||
| Marketing and advertising cost | d | |||
| Miscelleaneous costs | e | |||
| Total cost for operations setup | 195200 |
Similarly, estimate the costs for upcoming years considering Equipment Upgrades, Increased logistics and variable costs as production scales, & Sustained marketing efforts.
Step 3: Revenue Projections
Forecast your revenue based on expected sales volumes and pricing strategies. Adjust these projections for market growth and your company’s market share over time. One of good pricing strategy is the Van Westendorp Pricing Model.
Example: Revenue Projection of Mead Project
- Pricing
Using primary survey, optimal price point of Rs 150 & Indifference price point of Rs 180 were identified through Van Westendorp Pricing Model. The optimal price point of Rs 150 represents the price at which the highest number of customers perceive the product as being reasonably priced and are most likely to make a purchase. The indifference price point of Rs 180 is the price at which customers are indifferent, meaning they see the price as acceptable but not necessarily a bargain, balancing between acceptable value and cost. We will price Rs 150 initially to gain customers and then we can shift to Rs 180 price point.
- Year 1: ₹150 per 350ml bottle
- Year 2: ₹150 per bottle
- Year 3: ₹180 per bottle
- Year 4: ₹180 per bottle
- Sales Volume:
- Year 1: 920,000 bottles (Identified in Step 1)
- Year 2: 1,265,000 bottles (Estimated considering the market growth and market capture rate)
- Year 3: P bottles
- Year 4: Q bottles
- Revenue:
- Year 1: ₹138,000 (in ‘000s)
- Year 2: ₹189,750
- Year 3: ₹A
- Year 4: ₹B
Step 4: Profitability Analysis
Calculate the net profit or loss by subtracting total costs from total revenue. Analyze at what point the business will break even and begin to generate profit.
Example:
- Net Profit/Loss:
- Year 1: -₹57,200
- Year 2: ₹69,863.75
- Year 3: ₹X
- Year 4: ₹Y
- Break-even Point:
- Achieved in Quarter 3 of Year 2
Step 5: Financial Highlights and Takeaways
Summarize the key financial metrics and insights, including the break-even point and net present value (NPV). This helps stakeholders quickly grasp the financial health and viability of the project.
Example:
- Net Present Value (NPV): ₹13.1 crore
- Break-even Point: Quarter 3, Year 2
Conclusion
Achieving break-even in less than two years demonstrates a quick recovery of initial investment, reducing financial risk and enhancing liquidity. This quick payback period provides confidence that the project will become self-sustaining and profitable in a short period, which is particularly appealing to investors and stakeholders.
A positive NPV suggests that the project is expected to generate more value than it costs, making it financially attractive. This strong NPV supports proceeding with the project, as it indicates potential for significant returns on investment.
By following these steps, you can create a comprehensive financial plan that supports your marketing and business strategies. This framework is versatile and can be applied across various industries to ensure that your business has the financial backbone to succeed.
References:
- Alcoholic Beverage Example – Previous Case Competition
- Competitor Benchmarking
- Van Westendorp Pricing Model
- Net Present Value (NPV)
Leave a Reply
You must be logged in to post a comment.